Uncertainty
For this exercise you’ll practice visualizing uncertainty by making histograms, density plots, and raincloud plots. You’ll use data on state-level spending on children from 1997–2016. The data was collected by the Urban Institute from a variety of government sources. It was a #TidyTuesday dataset in September 2020.
As always, if you’re struggling, please use Discord and talk to me and your classmates! Don’t suffer in silence!
ImportantCheck the example!
The example page for this week will be helpful!
Important{gghalves} updates!
{ggplot2} 4.0 was released in September 2025 (see here for all its new features) and it introduced some feautres that broke many packages that extend ggplot, including {gghalves}. If you install the version of {gghalves} from CRAN like normal, you’ll get errors like this:
#> Error in geom_half_point() :
#> ℹ Error occurred in the 1st layer.
#> Caused by error in fun():
#> ! argument "layout" is missing, with no default
This has been reported as a bug here. One of the main ggplot developers made a copy of {gghalves} and fixed the issue, though. The fix hasn’t been incorporated into the main {gghalves} package yet, but you can install his version by (1) restarting your R session, and (2) running this:
remotes::install_github("teunbrand/gghalves@compat_ggplot2_400")That’ll replace the normal version of {gghalves} with the fixed version for ggplot 4.0. Eventually the {gghalves} developer will merge those changes into the main package, but this works for now!
Instructions
Open the project either on your computer or in Posit.cloud
-
06-exercise.zip: If you’re using R on your own computer, download this file, unzip it, and double click on the file named06-exercise.Rproj - Posit.cloud project: Use this link if you’re using Posit.cloud in your browser
-
Rename the Quarto file named
your-name_exercise-6.qmdto something that matches your name and open it in RStudio.Complete the tasks given in the Quarto file. You can definitely copy, paste, and adapt from other code in the document or the example page—don’t try to write everything from scratch!
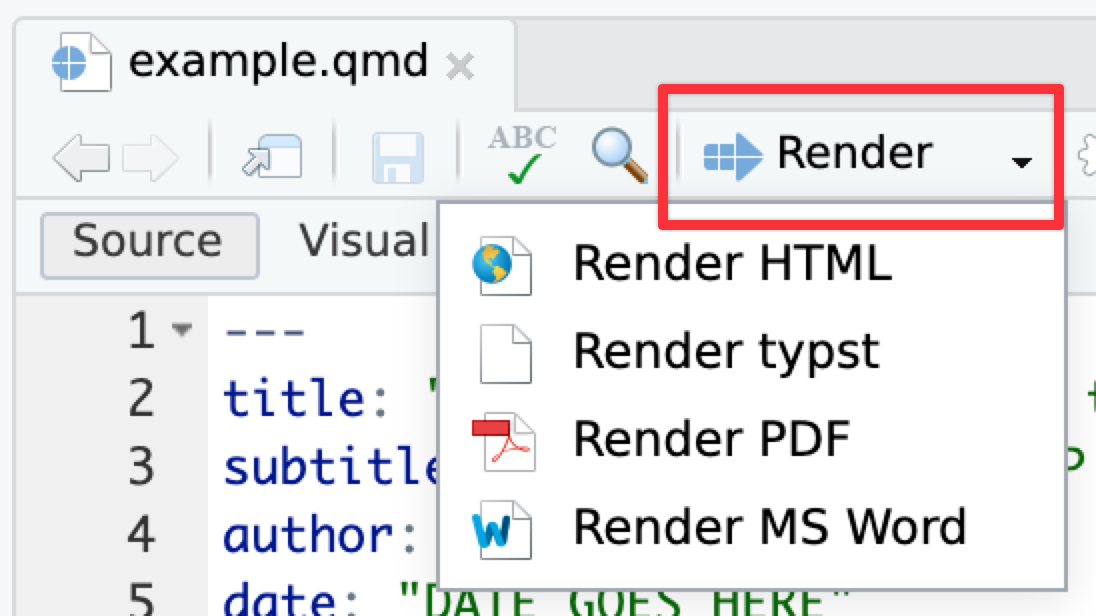
When you’re all done, click on the “Render” button at the top of the editing window and create a Typst (pdf), PDF, or Word version of your document. Upload that file to iCollege. Do not upload a rendered HTML file (they don’t work on iCollege).
Tips
TipRunning chunks
Remember that you can run an entire chunk by clicking on the green play arrow in the top right corner of the chunk. You can also run lines of code line-by-line if you place your cursor on some R code and press ⌘ + enter (for macOS users) or ctrl + enter (for Windows users).
Make sure you run each chunk sequentially. If you run a chunk in the middle of the document without running previous ones, it might not work, since previous chunks might do things that later chunks depend on.
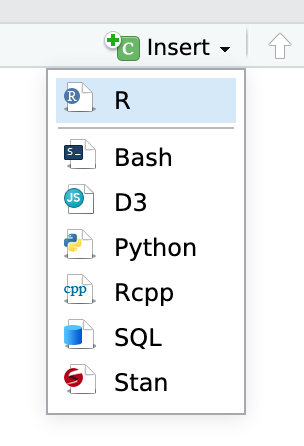
TipInserting chunks
You’ll need to insert some of your own code chunks. Rather than typing them by hand (that’s tedious!), use the “Insert” button at the top of the editing window, or press ⌥ + ⌘ + I on macOS, or ctrl + alt + I on Windows.